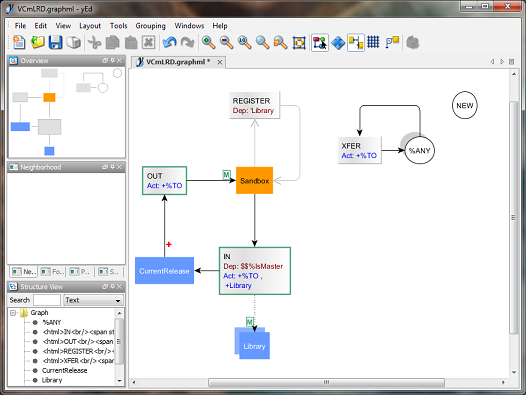
Locations and Routes Diagram
This function generates a GraphML file that you render using the free yEd graph editor from yWorks. To create a diagram, follow these instructions:
- If yEd is not already installed, download it from http://www.yworks.com and install it, opting to associate the .graphml extension with yEd.
- After choosing View->Locations and Routes... Click 'OK' on the dialog to generate and download the GraphML file.
- When prompted by your browser, open the file in yEd. Alternatively, save it for later use.
- In yEd use Tools->Fit Node to Label. Suggested values for this operation are:
- Act on Selection Only; Adapt to Maximum Node; Ignore Width; Ignore Height: unchecked
- Horizontal Space: 5
- Minimum Width: 10
- Vertical Space: 5
- Minimum Height: 45
- Use Layout->Orthogonal->Classic. Suggested values are:
- Layout Style: Node Boxes (Size Fixed)
- Length Reduction; Crossing Postprocessing; Minimize Perceived Bends; Use Randomization: checked
- Edge Labeling: None
Tips:
- Make route crossings clearer by setting a Bridge Style on the Display tab of File->Preferences.
- Select a location node, then use one of the Context Views from the 'Windows' menu. Neighborhood focuses on routes to and from the location. Predecessors shows workflow to the location. Successors shows workflow from the location.
- If you have a mousewheel, use it to zoom the diagram.
- Panning around the diagram can easily be done by dragging the white rectangle within the Overview pane (opened using Windows->Overview). Dragging the lower right corner of the same rectangle alters diagram zoom.
- 'Local Zoom', accessed off the toolbar or via the 'View' menu, assists exploration of a large zoomed-out diagram.
See Also: Locations, Transfer Routes, yWorks